


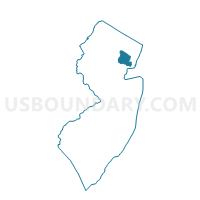
Census Tract 198, Essex County, New Jersey
About
Outline

Summary
| Unique Area Identifier | 473570 |
| Name | Census Tract 198 |
| County | Essex County |
| State | New Jersey |
| Area (square miles) | 0.33 |
| Land Area (square miles) | 0.33 |
| Water Area (square miles) | 0.00 |
| % of Land Area | 100.00 |
| % of Water Area | 0.00 |
| Latitude of the Internal Point | 40.72259360 |
| Longtitude of the Internal Point | -74.27226380 |
| Total Population | 2,639 |
| Total Housing Units | 902 |
| Total Households | 867 |
| Median Age | 39.4 |
Maps

Graphs
Select a template below for downloading or customizing gragh for Census Tract 198, Essex County, New Jersey


Neighbors
Neighoring Census Tract (by Name) Neighboring Census Tract on the Map
- Census Tract 195, Essex County, NJ
- Census Tract 196, Essex County, NJ
- Census Tract 197, Essex County, NJ
- Census Tract 199, Essex County, NJ
- Census Tract 202, Essex County, NJ
- Census Tract 328, Union County, NJ
Top 10 Neighboring County Subdivision (by Population) Neighboring County Subdivision on the Map
- Union township, Union County, NJ (56,642)
- Maplewood township, Essex County, NJ (23,867)
- Millburn township, Essex County, NJ (20,149)
Top 10 Neighboring Unified School District (by Population) Neighboring Unified School District on the Map
- Union Township School District, NJ (56,642)
- South Orange-Maplewood School District, NJ (40,065)
- Millburn Township School District, NJ (20,149)
Top 10 Neighboring State Legislative District Lower Chamber (by Population) Neighboring State Legislative District Lower Chamber on the Map
- General Assembly District 21, NJ (219,875)
- General Assembly District 20, NJ (210,628)
- General Assembly District 27, NJ (204,496)
Top 10 Neighboring State Legislative District Upper Chamber (by Population) Neighboring State Legislative District Upper Chamber on the Map
- State Senate District 21, NJ (219,875)
- State Senate District 20, NJ (210,628)
- State Senate District 27, NJ (204,496)
Top 10 Neighboring 111th Congressional District (by Population) Neighboring 111th Congressional District on the Map
Top 10 Neighboring 5-Digit ZIP Code Tabulation Area (by Population) Neighboring 5-Digit ZIP Code Tabulation Area on the Map
Explore Neighbors on the MapData
Demographic, Population, Households, and Housing Units
** Data sources from census 2010 **
Show Data on Map
Download Full List as CSV
Download Quick Sheet as CSV
| Subject | This Area | Essex County | New Jersey | National |
|---|---|---|---|---|
| POPULATION | ||||
| Total Population Map | 2,639 | 783,969 | 8,791,894 | 308,745,538 |
| POPULATION, HISPANIC OR LATINO ORIGIN | ||||
| Not Hispanic or Latino Map | 2,470 | 624,852 | 7,236,750 | 258,267,944 |
| Hispanic or Latino Map | 169 | 159,117 | 1,555,144 | 50,477,594 |
| POPULATION, RACE | ||||
| White alone Map | 1,810 | 333,868 | 6,029,248 | 223,553,265 |
| Black or African American alone Map | 580 | 320,479 | 1,204,826 | 38,929,319 |
| American Indian and Alaska Native alone Map | 8 | 3,056 | 29,026 | 2,932,248 |
| Asian alone Map | 100 | 35,789 | 725,726 | 14,674,252 |
| Native Hawaiian and Other Pacific Islander alone Map | 0 | 286 | 3,043 | 540,013 |
| Some Other Race alone Map | 52 | 65,687 | 559,722 | 19,107,368 |
| Two or More Races Map | 89 | 24,804 | 240,303 | 9,009,073 |
| POPULATION, SEX | ||||
| Male Map | 1,289 | 375,964 | 4,279,600 | 151,781,326 |
| Female Map | 1,350 | 408,005 | 4,512,294 | 156,964,212 |
| POPULATION, AGE (18 YEARS) | ||||
| 18 years and over Map | 1,814 | 589,051 | 6,726,680 | 234,564,071 |
| Under 18 years | 825 | 194,918 | 2,065,214 | 74,181,467 |
| POPULATION, AGE | ||||
| Under 5 years | 236 | 53,819 | 541,020 | 20,201,362 |
| 5 to 9 years | 275 | 53,756 | 564,750 | 20,348,657 |
| 10 to 14 years | 211 | 53,781 | 587,335 | 20,677,194 |
| 15 to 17 years | 103 | 33,562 | 372,109 | 12,954,254 |
| 18 and 19 years | 37 | 21,341 | 225,990 | 9,086,089 |
| 20 years | 20 | 10,547 | 108,760 | 4,519,129 |
| 21 years | 12 | 10,424 | 106,219 | 4,354,294 |
| 22 to 24 years | 62 | 31,814 | 326,259 | 12,712,576 |
| 25 to 29 years | 66 | 53,126 | 553,139 | 21,101,849 |
| 30 to 34 years | 118 | 54,529 | 556,662 | 19,962,099 |
| 35 to 39 years | 208 | 56,903 | 588,379 | 20,179,642 |
| 40 to 44 years | 268 | 59,318 | 649,918 | 20,890,964 |
| 45 to 49 years | 253 | 59,518 | 704,516 | 22,708,591 |
| 50 to 54 years | 218 | 55,706 | 674,680 | 22,298,125 |
| 55 to 59 years | 182 | 46,553 | 565,623 | 19,664,805 |
| 60 and 61 years | 52 | 16,776 | 201,084 | 7,113,727 |
| 62 to 64 years | 73 | 22,209 | 279,458 | 9,704,197 |
| 65 and 66 years | 37 | 11,764 | 149,028 | 5,319,902 |
| 67 to 69 years | 56 | 15,644 | 201,944 | 7,115,361 |
| 70 to 74 years | 59 | 20,158 | 260,462 | 9,278,166 |
| 75 to 79 years | 32 | 16,117 | 215,715 | 7,317,795 |
| 80 to 84 years | 27 | 12,977 | 179,233 | 5,743,327 |
| 85 years and over | 34 | 13,627 | 179,611 | 5,493,433 |
| MEDIAN AGE BY SEX | ||||
| Both sexes Map | 39.40 | 36.40 | 39.00 | 37.20 |
| Male Map | 38.60 | 34.80 | 37.40 | 35.80 |
| Female Map | 40.10 | 37.90 | 40.30 | 38.50 |
| HOUSEHOLDS | ||||
| Total Households Map | 867 | 283,712 | 3,214,360 | 116,716,292 |
| HOUSEHOLDS, HOUSEHOLD TYPE | ||||
| Family households: Map | 706 | 189,339 | 2,226,606 | 77,538,296 |
| Husband-wife family Map | 571 | 113,673 | 1,643,377 | 56,510,377 |
| Other family: Map | 135 | 75,666 | 583,229 | 21,027,919 |
| Male householder, no wife present Map | 28 | 17,206 | 154,134 | 5,777,570 |
| Female householder, no husband present Map | 107 | 58,460 | 429,095 | 15,250,349 |
| Nonfamily households: Map | 161 | 94,373 | 987,754 | 39,177,996 |
| Householder living alone Map | 116 | 78,528 | 811,221 | 31,204,909 |
| Householder not living alone Map | 45 | 15,845 | 176,533 | 7,973,087 |
| HOUSEHOLDS, HISPANIC OR LATINO ORIGIN OF HOUSEHOLDER | ||||
| Not Hispanic or Latino householder: Map | 830 | 236,442 | 2,777,617 | 103,254,926 |
| Hispanic or Latino householder: Map | 37 | 47,270 | 436,743 | 13,461,366 |
| HOUSEHOLDS, RACE OF HOUSEHOLDER | ||||
| Householder who is White alone | 624 | 127,947 | 2,340,060 | 89,754,352 |
| Householder who is Black or African American alone | 192 | 116,785 | 428,304 | 14,129,983 |
| Householder who is American Indian and Alaska Native alone | 2 | 994 | 8,686 | 939,707 |
| Householder who is Asian alone | 24 | 11,039 | 223,319 | 4,632,164 |
| Householder who is Native Hawaiian and Other Pacific Islander alone | 0 | 97 | 925 | 143,932 |
| Householder who is Some Other Race alone | 9 | 19,583 | 152,495 | 4,916,427 |
| Householder who is Two or More Races | 16 | 7,267 | 60,571 | 2,199,727 |
| HOUSEHOLDS, HOUSEHOLD TYPE BY HOUSEHOLD SIZE | ||||
| Family households: Map | 706 | 189,339 | 2,226,606 | 77,538,296 |
| 2-person household Map | 183 | 62,644 | 812,884 | 31,882,616 |
| 3-person household Map | 185 | 48,941 | 539,679 | 17,765,829 |
| 4-person household Map | 236 | 42,382 | 498,316 | 15,214,075 |
| 5-person household Map | 74 | 20,830 | 228,492 | 7,411,997 |
| 6-person household Map | 19 | 8,254 | 86,142 | 3,026,278 |
| 7-or-more-person household Map | 9 | 6,288 | 61,093 | 2,237,501 |
| Nonfamily households: Map | 161 | 94,373 | 987,754 | 39,177,996 |
| 1-person household Map | 116 | 78,528 | 811,221 | 31,204,909 |
| 2-person household Map | 41 | 12,869 | 144,798 | 6,360,012 |
| 3-person household Map | 3 | 1,783 | 18,350 | 992,156 |
| 4-person household Map | 1 | 772 | 7,791 | 411,171 |
| 5-person household Map | 0 | 264 | 3,235 | 126,634 |
| 6-person household Map | 0 | 81 | 1,302 | 48,421 |
| 7-or-more-person household Map | 0 | 76 | 1,057 | 34,693 |
| HOUSING UNITS | ||||
| Total Housing Units Map | 902 | 312,954 | 3,553,562 | 131,704,730 |
| HOUSING UNITS, OCCUPANCY STATUS | ||||
| Occupied Map | 867 | 283,712 | 3,214,360 | 116,716,292 |
| Vacant Map | 35 | 29,242 | 339,202 | 14,988,438 |
| HOUSING UNITS, OCCUPIED, TENURE | ||||
| Owned with a mortgage or a loan Map | 664 | 97,293 | 1,532,012 | 52,979,430 |
| Owned free and clear Map | 144 | 31,053 | 570,453 | 23,006,644 |
| Renter occupied Map | 59 | 155,366 | 1,111,895 | 40,730,218 |
| HOUSING UNITS, VACANT, VACANCY STATUS | ||||
| For rent Map | 12 | 16,537 | 92,118 | 4,137,567 |
| Rented, not occupied Map | 3 | 656 | 4,578 | 206,825 |
| For sale only Map | 7 | 3,259 | 39,260 | 1,896,796 |
| Sold, not occupied Map | 5 | 620 | 8,145 | 421,032 |
| For seasonal, recreational, or occasional use Map | 1 | 924 | 134,903 | 4,649,298 |
| For migrant workers Map | 0 | 1 | 156 | 24,161 |
| Other vacant Map | 7 | 7,245 | 60,042 | 3,652,759 |
| HOUSING UNITS, OCCUPIED, AVERAGE HOUSEHOLD SIZE BY TENURE | ||||
| Total: Map | 3.03 | 2.68 | 2.68 | 2.58 |
| Owner occupied Map | 3.08 | 2.95 | 2.79 | 2.65 |
| Renter occupied Map | 2.37 | 2.46 | 2.47 | 2.44 |
| HOUSING UNITS, OCCUPIED, TENURE BY RACE OF HOUSEHOLDER | ||||
| Owner occupied: Map | 808 | 128,346 | 2,102,465 | 75,986,074 |
| Householder who is White alone Map | 595 | 80,733 | 1,717,602 | 63,446,275 |
| Householder who is Black or African American alone Map | 168 | 33,220 | 171,748 | 6,261,464 |
| Householder who is American Indian and Alaska Native alone Map | 1 | 267 | 3,523 | 509,588 |
| Householder who is Asian alone Map | 24 | 7,156 | 137,287 | 2,688,861 |
| Householder who is Native Hawaiian and Other Pacific Islander alone Map | 0 | 20 | 375 | 61,911 |
| Householder who is Some Other Race alone Map | 5 | 4,601 | 45,382 | 1,975,817 |
| Householder who is Two or More Races Map | 15 | 2,349 | 26,548 | 1,042,158 |
| Renter occupied: Map | 59 | 155,366 | 1,111,895 | 40,730,218 |
| Householder who is White alone Map | 29 | 47,214 | 622,458 | 26,308,077 |
| Householder who is Black or African American alone Map | 24 | 83,565 | 256,556 | 7,868,519 |
| Householder who is American Indian and Alaska Native alone Map | 1 | 727 | 5,163 | 430,119 |
| Householder who is Asian alone Map | 0 | 3,883 | 86,032 | 1,943,303 |
| Householder who is Native Hawaiian and Other Pacific Islander alone Map | 0 | 77 | 550 | 82,021 |
| Householder who is Some Other Race alone Map | 4 | 14,982 | 107,113 | 2,940,610 |
| Householder who is Two or More Races Map | 1 | 4,918 | 34,023 | 1,157,569 |
| HOUSING UNITS, OCCUPIED, TENURE BY HISPANIC OR LATINO ORIGIN OF HOUSEHOLDER | ||||
| Owner occupied: Map | 808 | 128,346 | 2,102,465 | 75,986,074 |
| Not Hispanic or Latino householder Map | 776 | 114,874 | 1,943,837 | 69,617,625 |
| Hispanic or Latino householder Map | 32 | 13,472 | 158,628 | 6,368,449 |
| Renter occupied: Map | 59 | 155,366 | 1,111,895 | 40,730,218 |
| Not Hispanic or Latino householder Map | 54 | 121,568 | 833,780 | 33,637,301 |
| Hispanic or Latino householder Map | 5 | 33,798 | 278,115 | 7,092,917 |
| HOUSING UNITS, OCCUPIED, TENURE BY HOUSEHOLD SIZE | ||||
| Owner occupied: Map | 808 | 128,346 | 2,102,465 | 75,986,074 |
| 1-person household Map | 97 | 22,908 | 418,027 | 16,453,569 |
| 2-person household Map | 203 | 37,161 | 671,621 | 27,618,605 |
| 3-person household Map | 181 | 24,636 | 378,218 | 12,517,563 |
| 4-person household Map | 230 | 24,752 | 373,606 | 10,998,793 |
| 5-person household Map | 73 | 11,482 | 166,068 | 5,057,765 |
| 6-person household Map | 16 | 4,257 | 58,752 | 1,965,796 |
| 7-or-more-person household Map | 8 | 3,150 | 36,173 | 1,373,983 |
| Renter occupied: Map | 59 | 155,366 | 1,111,895 | 40,730,218 |
| 1-person household Map | 19 | 55,620 | 393,194 | 14,751,340 |
| 2-person household Map | 21 | 38,352 | 286,061 | 10,624,023 |
| 3-person household Map | 7 | 26,088 | 179,811 | 6,240,422 |
| 4-person household Map | 7 | 18,402 | 132,501 | 4,626,453 |
| 5-person household Map | 1 | 9,612 | 65,659 | 2,480,866 |
| 6-person household Map | 3 | 4,078 | 28,692 | 1,108,903 |
| 7-or-more-person household Map | 1 | 3,214 | 25,977 | 898,211 |
Loading...